Problem statement
We noticed that even with active sellers and listed containers, buyers weren’t finding what they needed. For every seller, there were only 3 buyers—far below what we’d expect for a healthy marketplace.
This low demand-to-supply ratio made it hard for sellers to get traction and for buyers to feel confident they’d succeed. The result: a frustrating buyer experience and eventually user churn.
Our focus was on the North American market, as most of our buyers are from that region. Most initiatives were specifically tailored for that.
Mission: Make xChange the best place to buy a container.
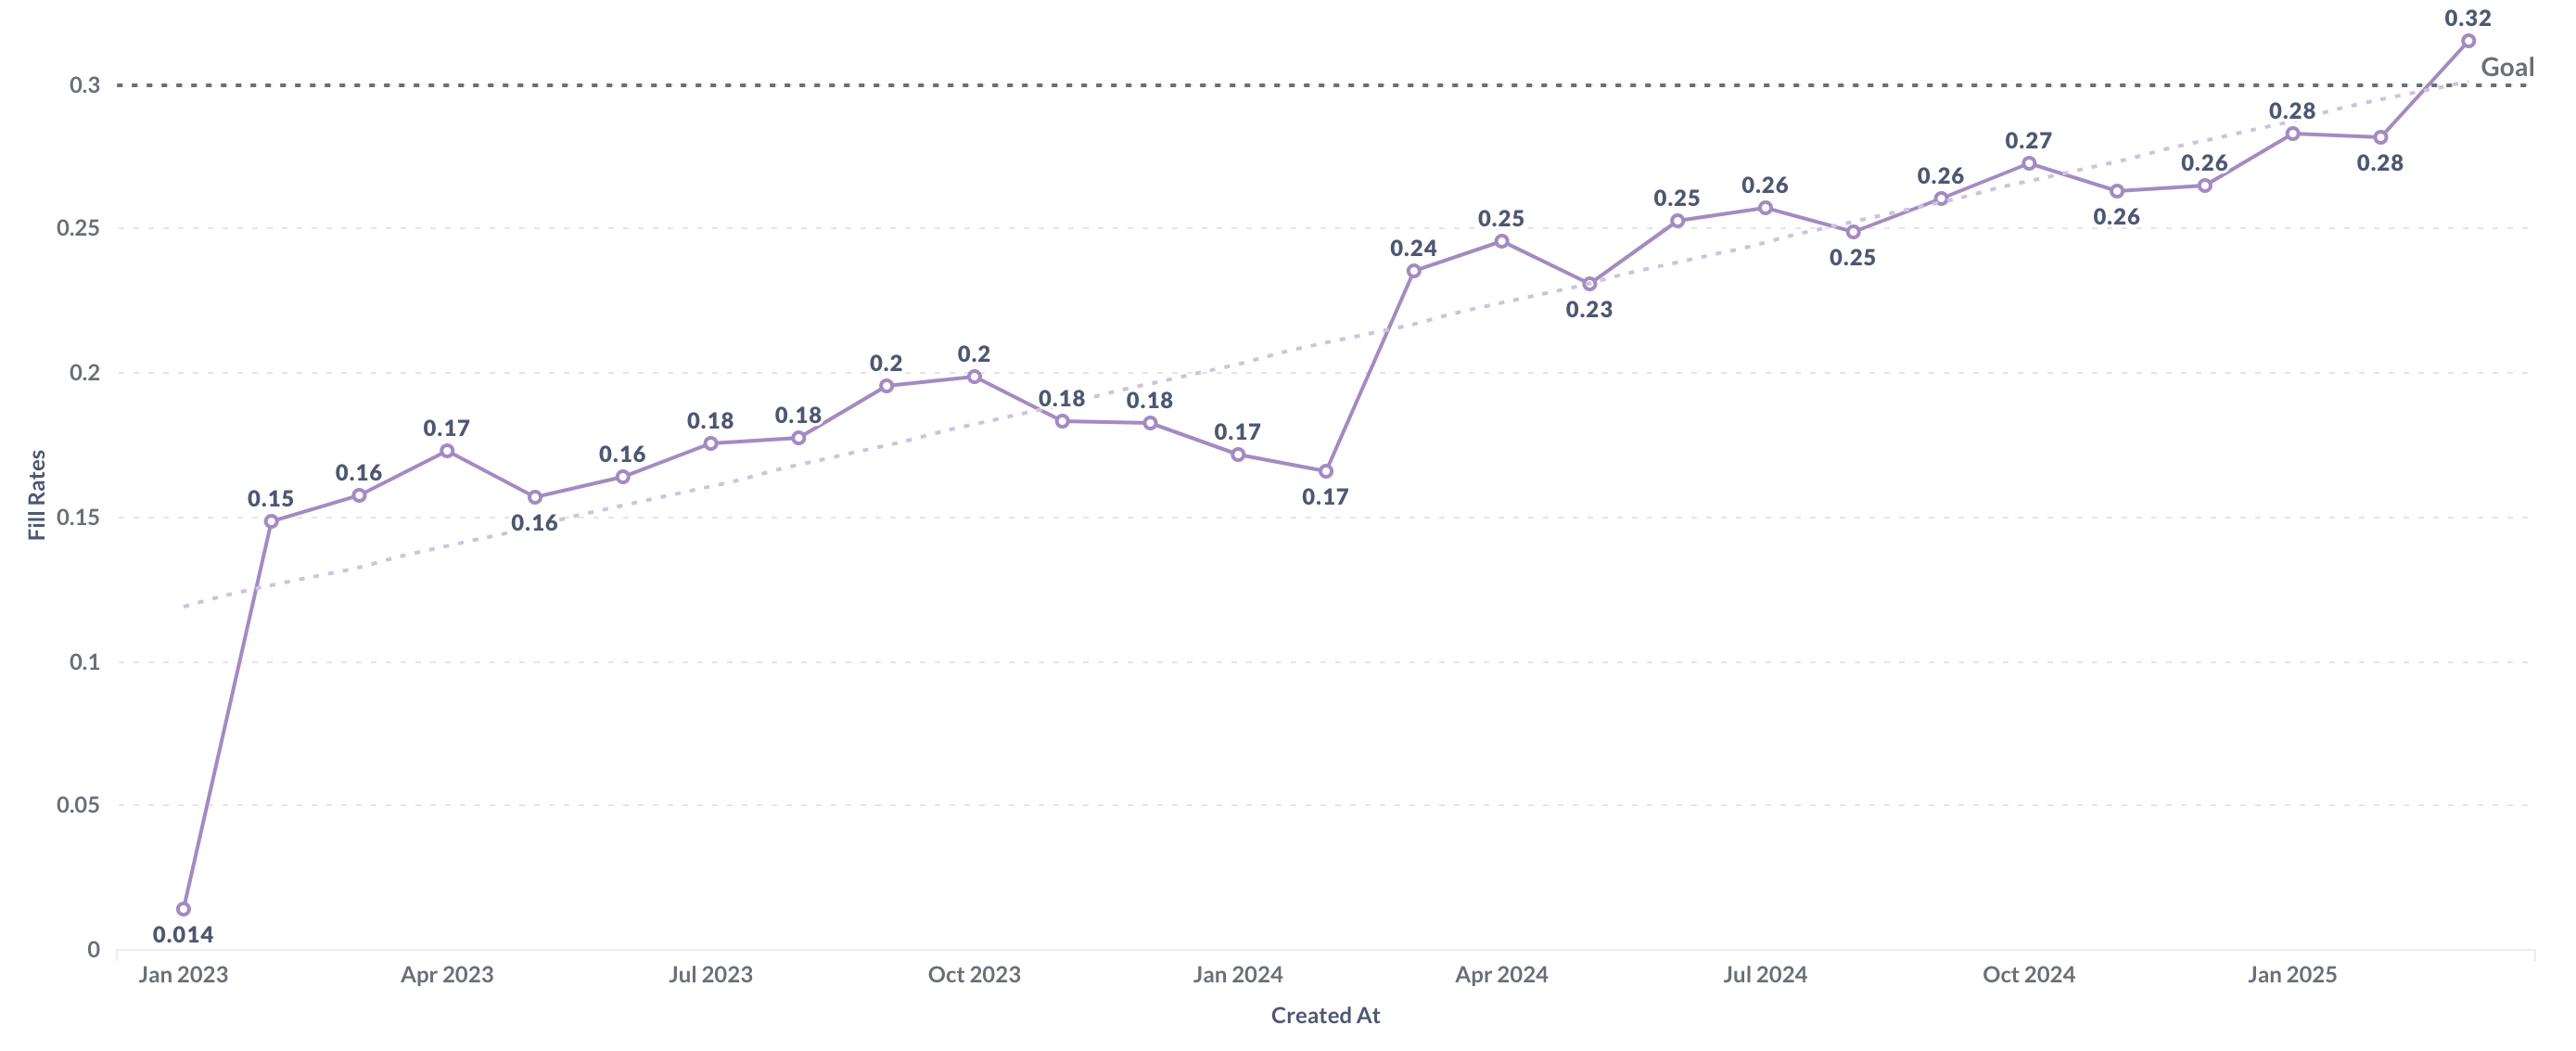
Main Metric: Boost demand fill rate (the % of buyer intents that turn into successful trades).
Our bet: If we reduce buyer friction and increase supply visibility, more deals will close.
Initiatives
High-volume supply uploads
We enabled sellers to bulk-upload their inventory via Google Sheets and connected this to our marketplace. This was specifically tailored to large-volume suppliers whose stock would fluctuate quickly. The addition of this Google Sheet led to huge boost in high-quality supply overnight: buyers were able to find nearly twice as much supply on xChange.

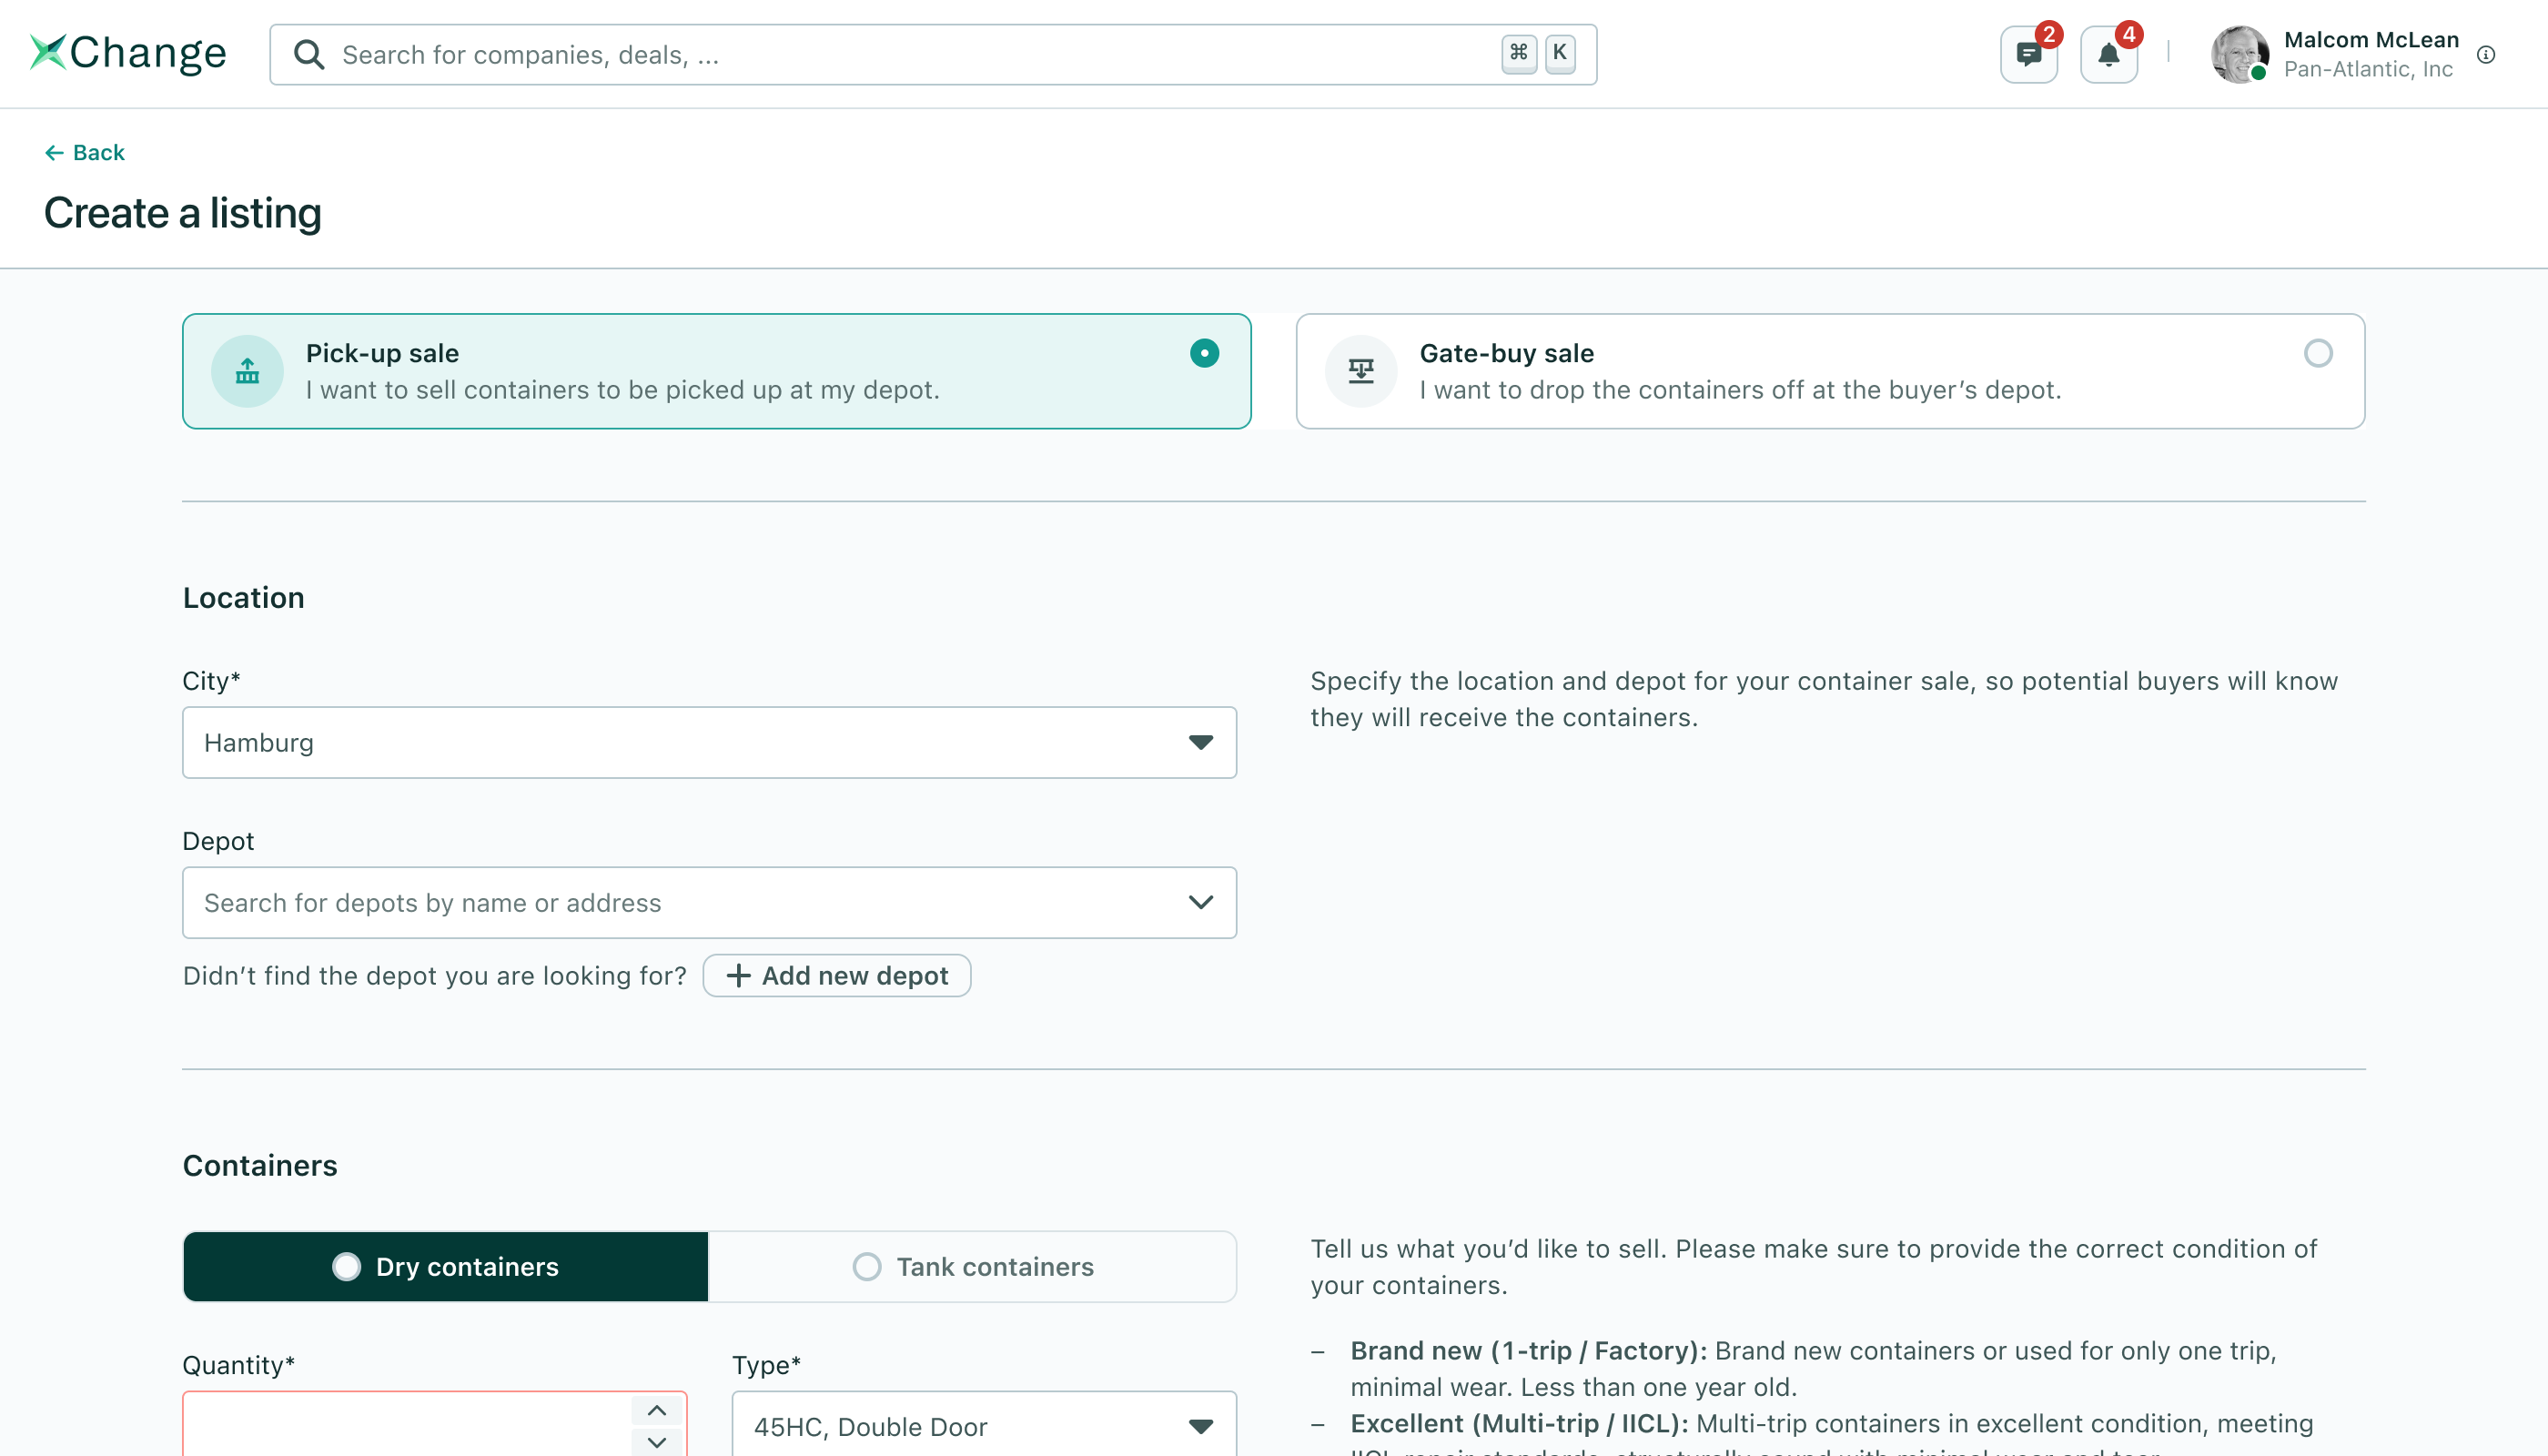
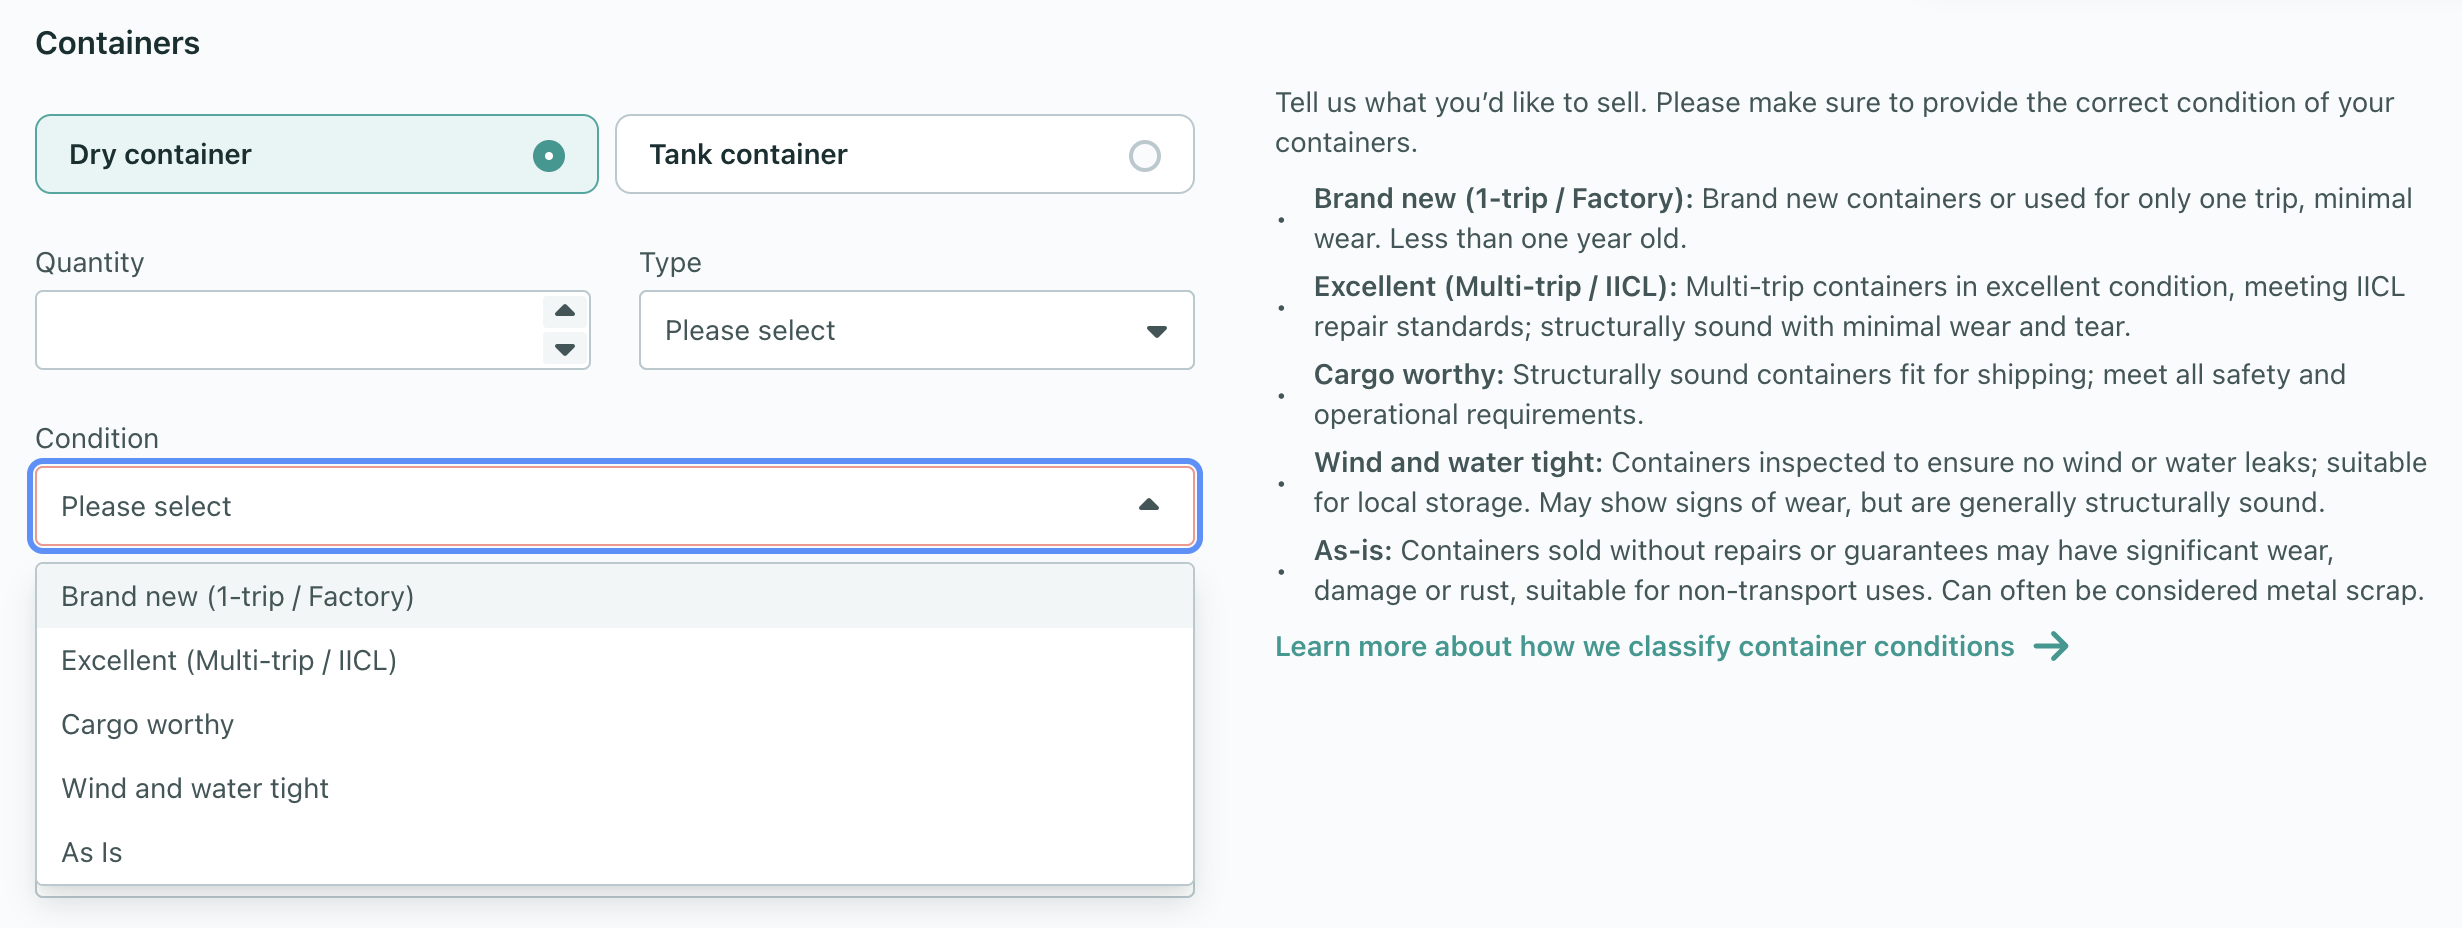
Easier supply creation
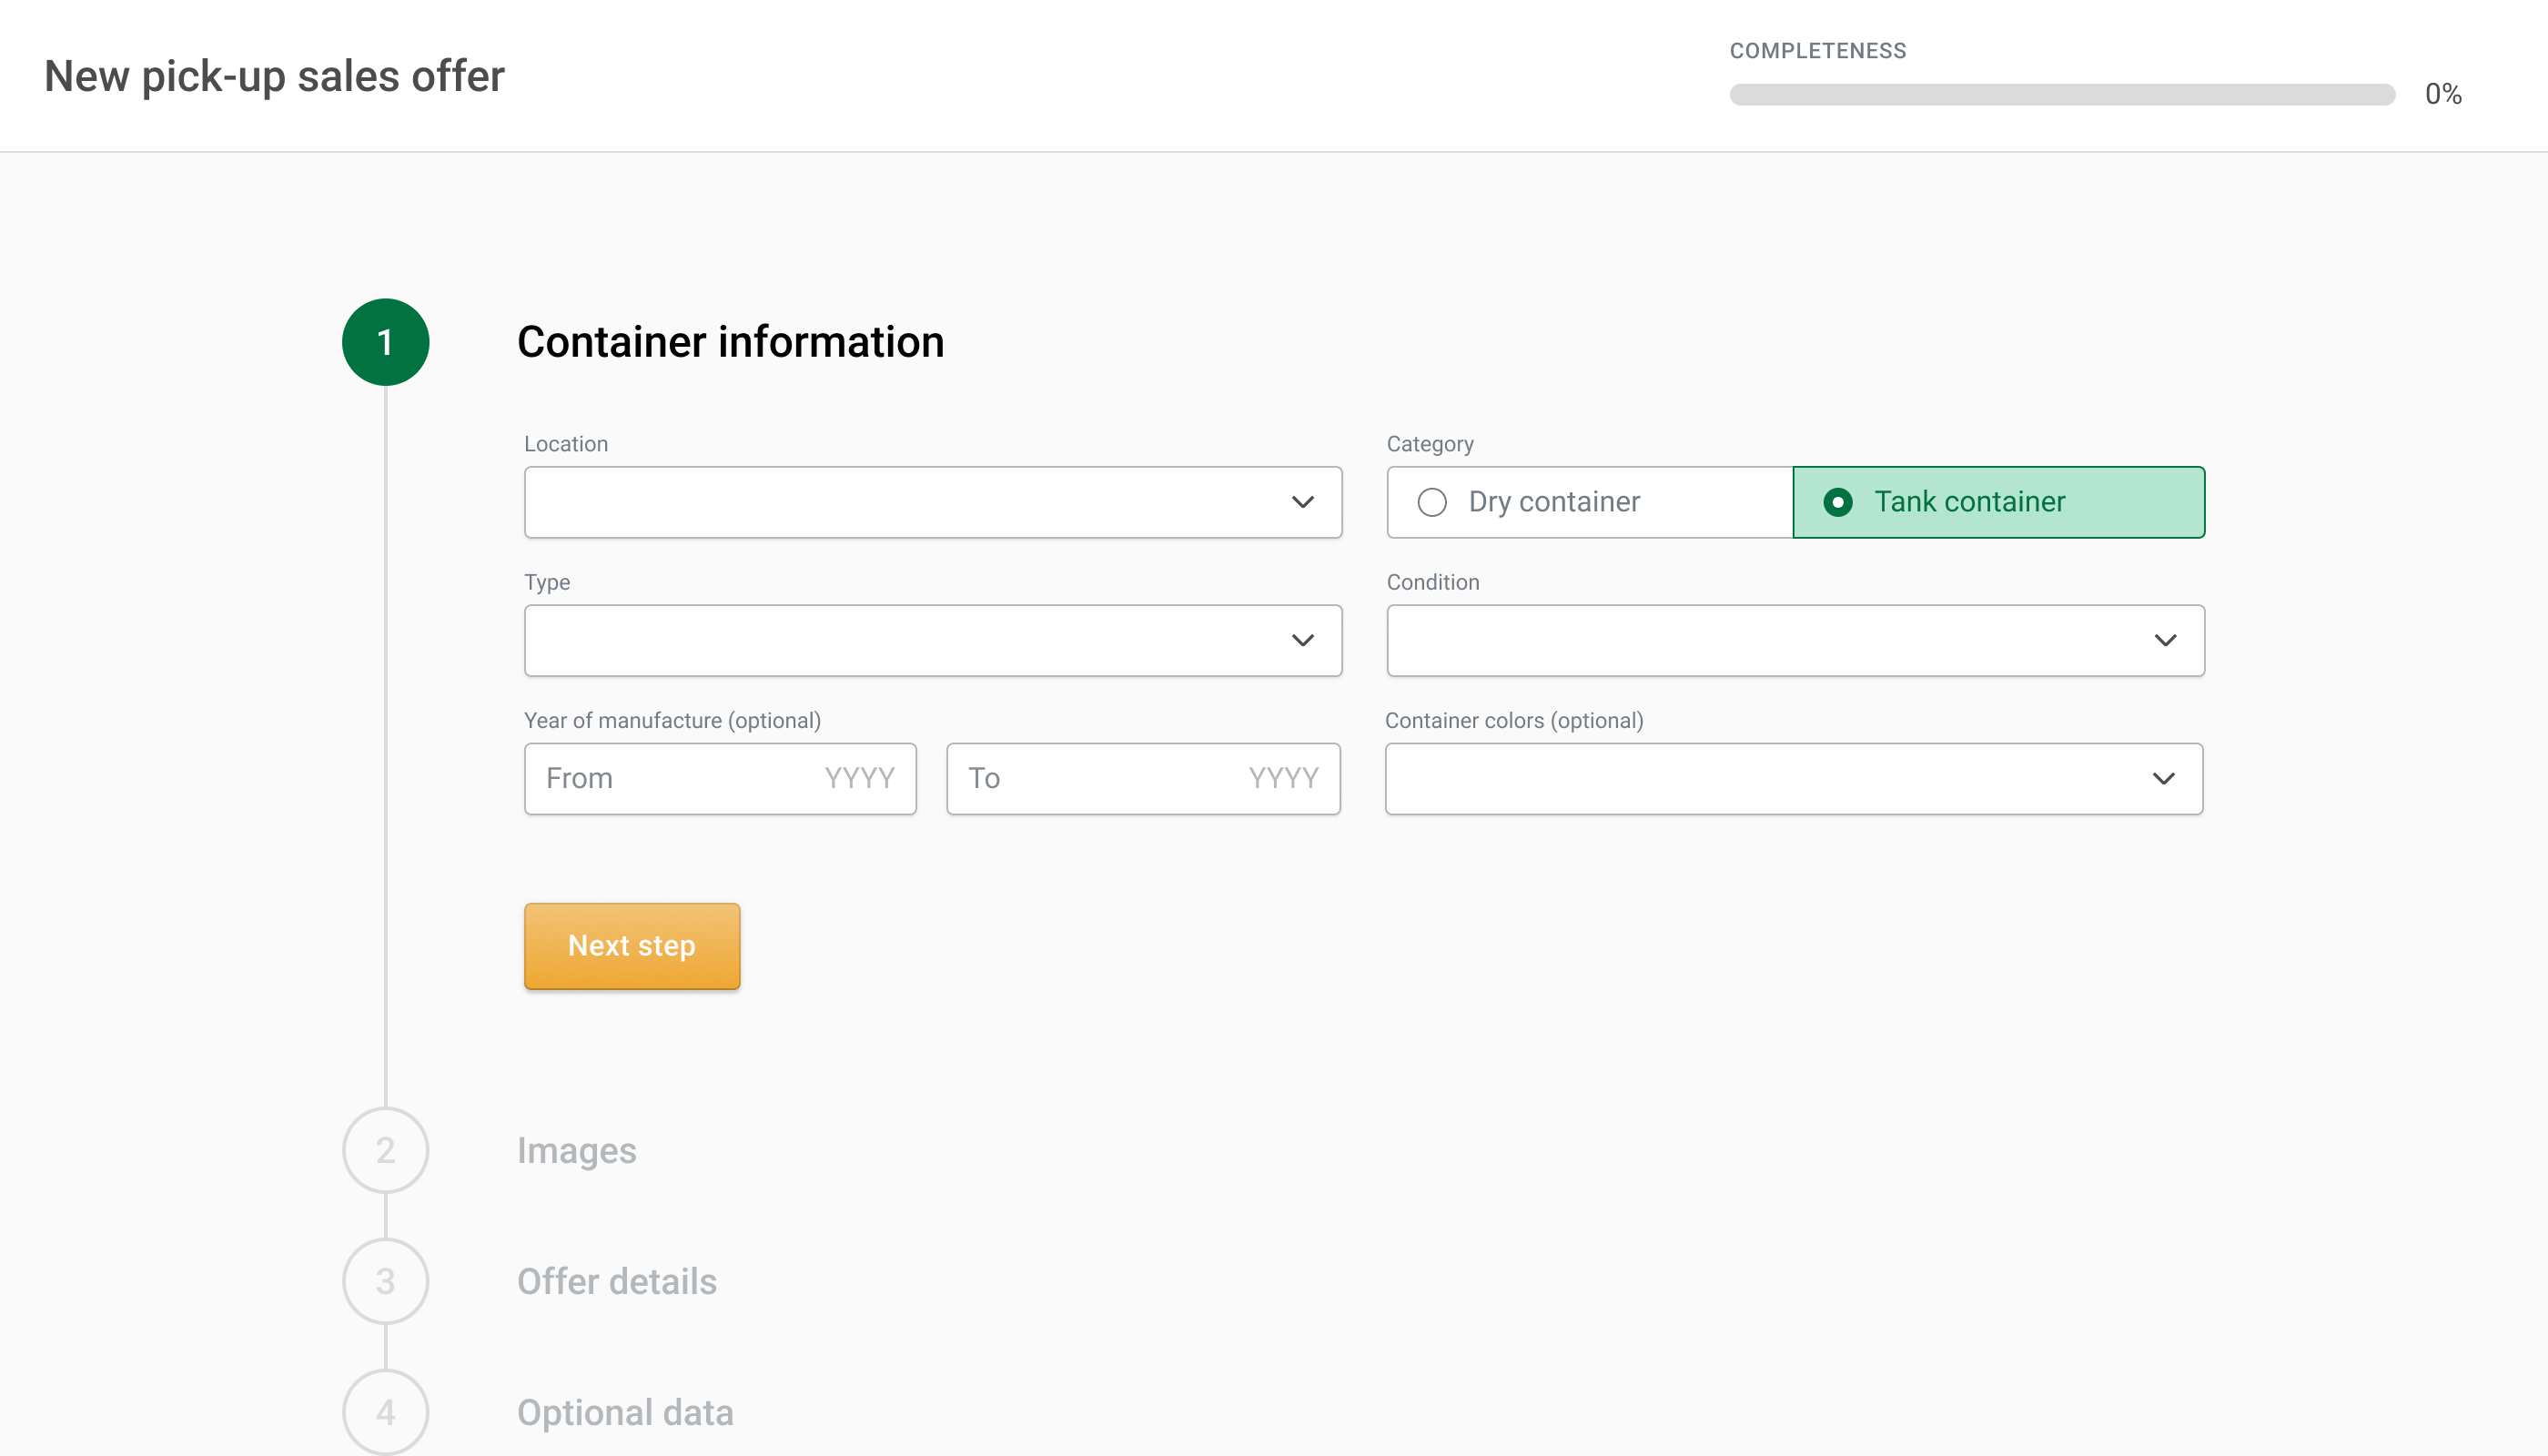
We turned a clunky, multi-step form into one scrollable page, because we could see users and even our internal staff struggling to navigate back and forth between form fields. Information got grouped more logically, reducing friction and speeding up submissions.
By reshuffling input fields to fit the context better, we nudged sellers to include more data to their listing — the relative amount of listings with depot location for example nearly doubled.
📈 Time to convert: ~60s → ~50s
📈 Conversion: ~87% → ~90%
Enforced supply information
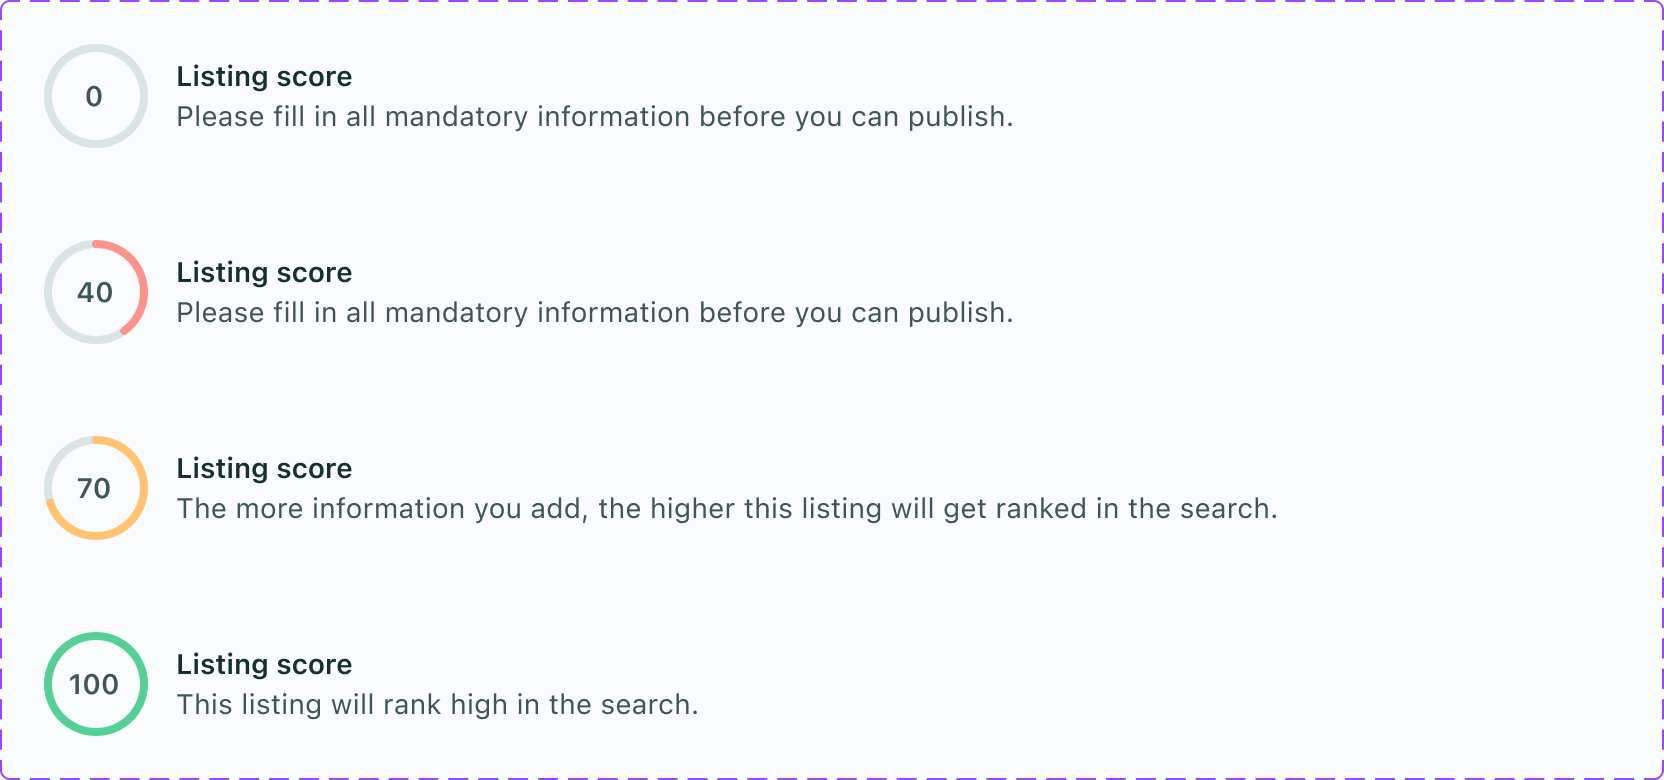
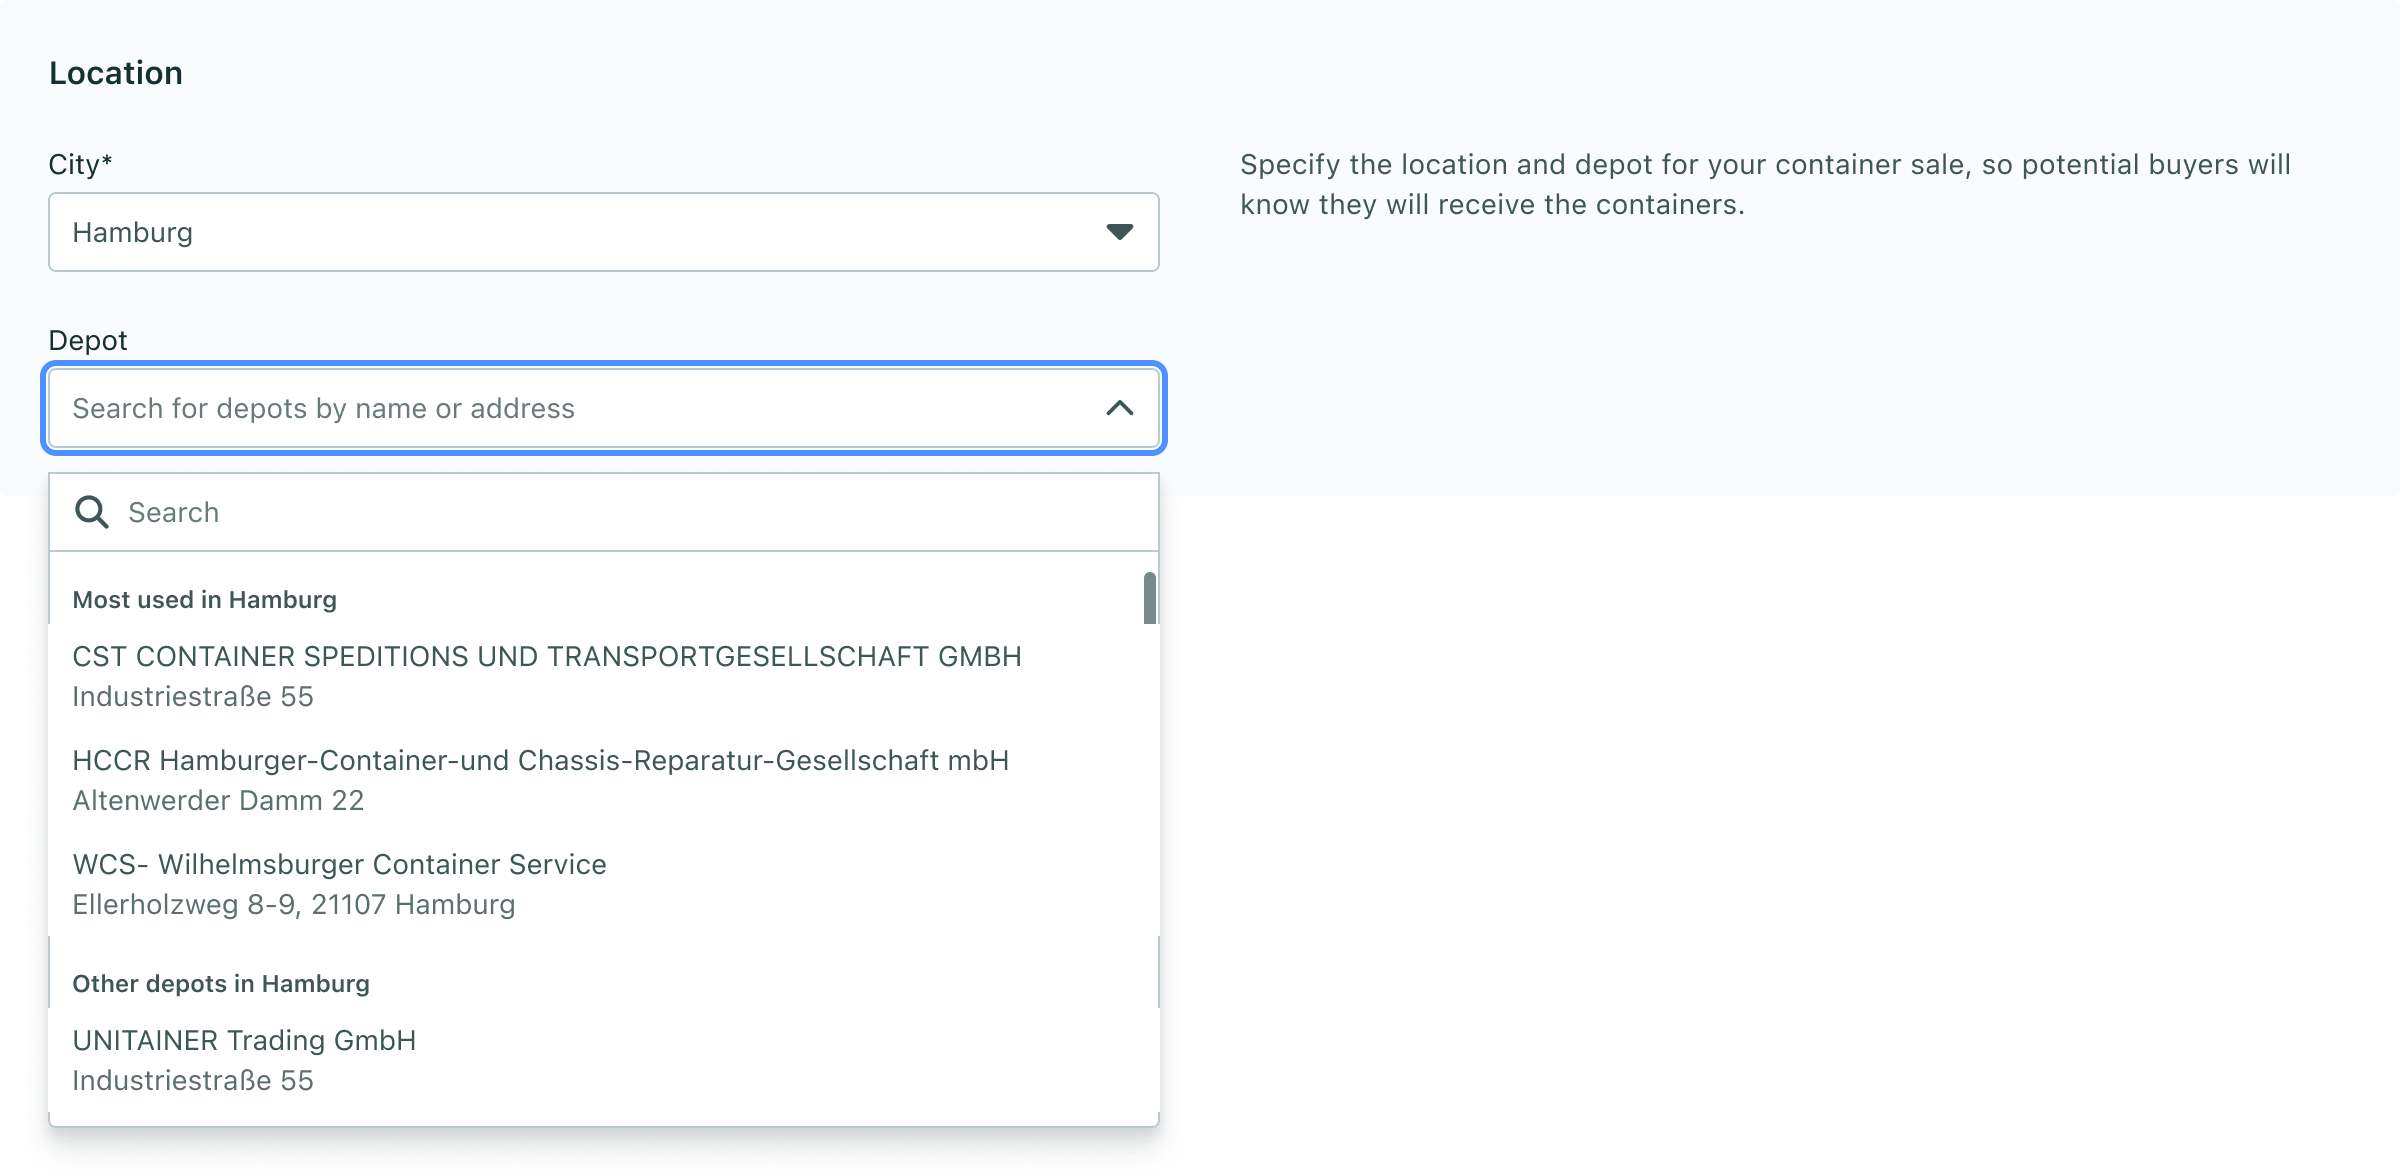
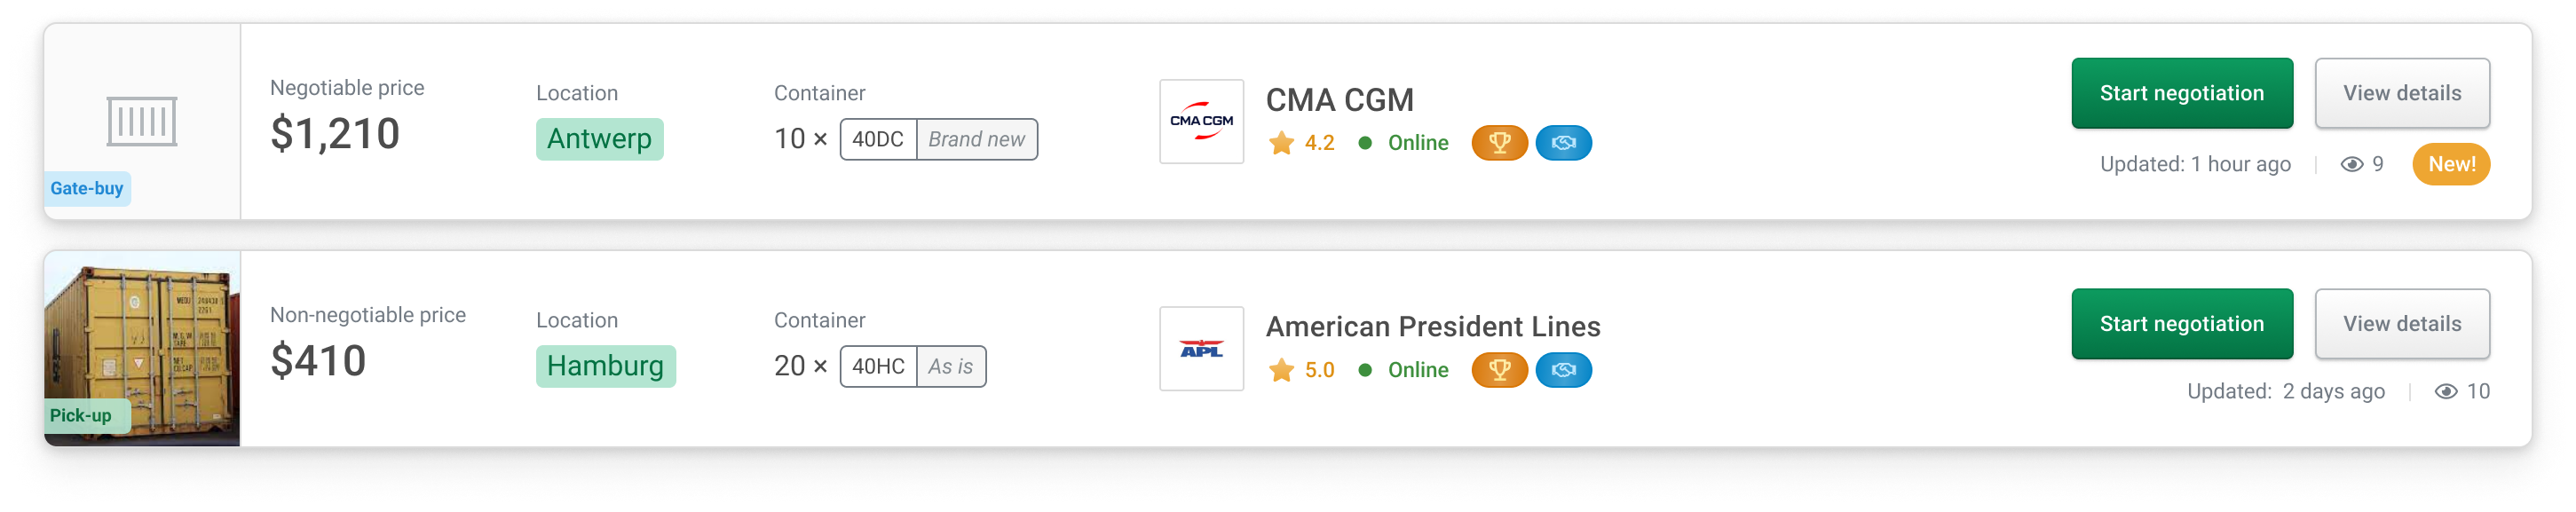
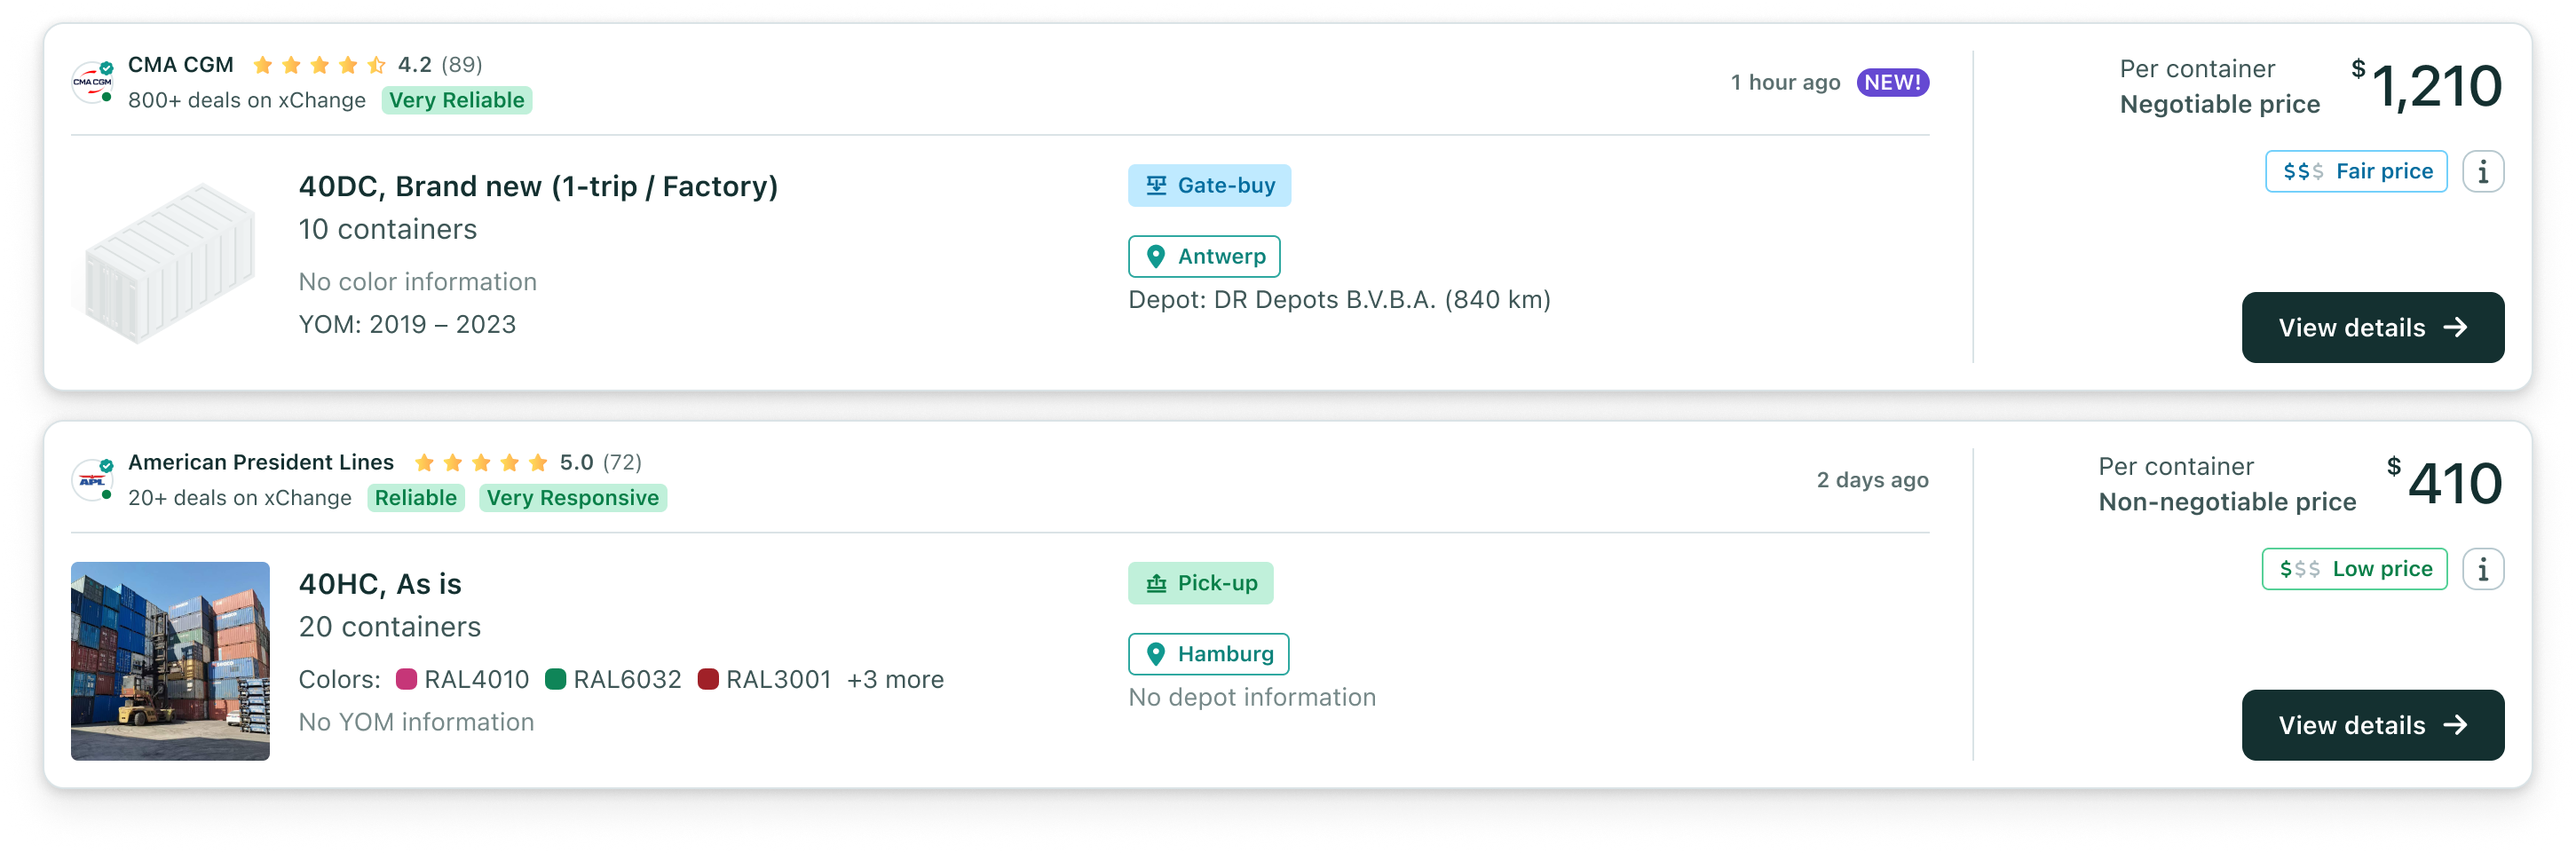
Buyers wanted more clarity on what containers they were looking at, for example information about condition, colors, year of manufacture and most importantly what depot they're located at. We enforced our sellers to add these to their listings. At the same time, we made this information visible to our buyers on the search results.
📈 Demand fill rate: 17% → 25%
Show price information
We built a price analyzer using data from our recent transactions based on location and container type. We would then cluster supply listing prices into low, fair or high and show the rating to potential buyers.
📈 Increased negotiation success rate: 22% to 38%
📉 Reduced negotiation time by 1½ days
Better search algorithm
We changed our recommendation system to list supply higher that would have more information and better pricing. This acted as a further boost to all metrics we had already improved.
More convenient payment methods
As mentioned previously, our target market was North America. Our existing payment methods (mainly credit card) were not sufficient enough, so we started rolling out ACH debit as a payment as well as a third-party tool to provide a credit limit.
Especially the credit limit would prove to be a great value proposition, leading to qualitative evidence of happier buyers.
Outcomes
Our initial bet was that we can help buyers close more deals by reducing friction and improving supply quality. Especially, we were measuring demand fill rate. With all these initiatives, we managed to not only double the demand fill rate but also improve many related KPIs.
📈 Doubled supply volume
📈 Increased negotiation success rate
📈 Lowered time from negotiation to deal
📈 More competitive listing prices → easier negotiations
📈 Demand fill rate: 17% → 32%
Learnings
Hypothesis-first mindset
We moved fast by framing sharp hypotheses and testing them in the simplest way possible. Manual efforts or no-code solutions helped us validate these hypotheses and or kill or commit to ideas before building them out.
Not all bets pay off
This case study shows what worked, but plenty didn’t. Even high-confidence ideas fizzled. Key takeaway: phrase sharp hypotheses, test them fast and decide how to move on later.